COVID-19 & Digital Access
Overview of analysis and findings
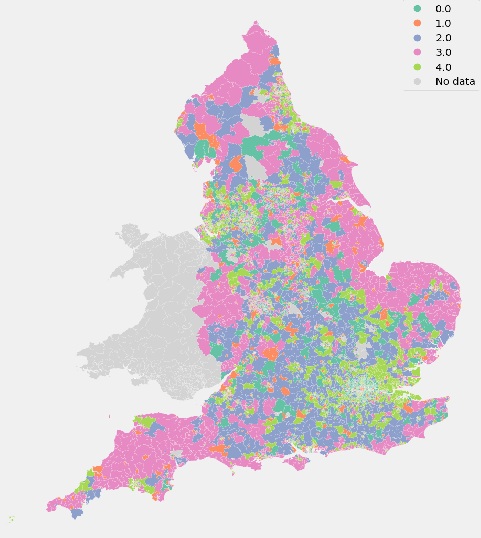
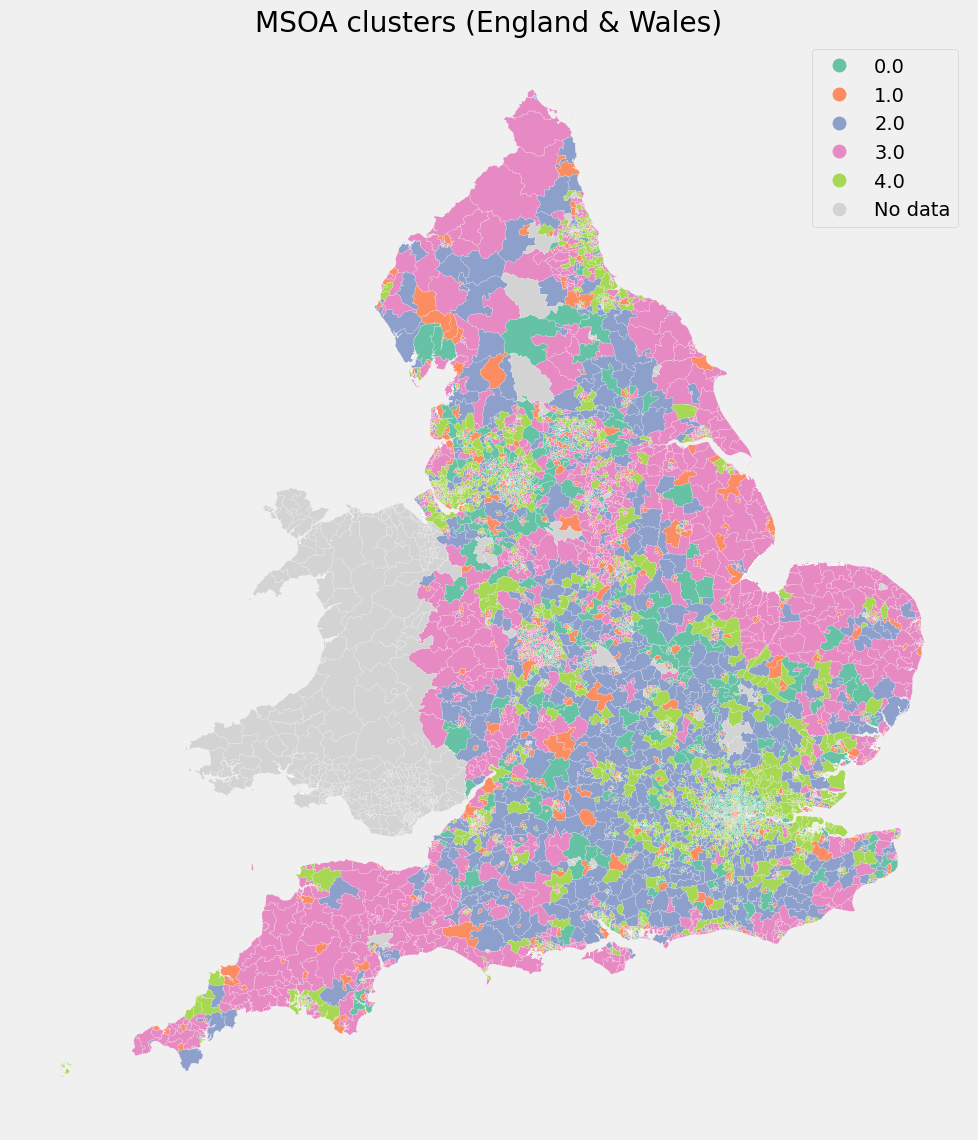
k-Means Clustering Analysis - COVID-19 Infection Rate, Digital Propensity and Access to Amenities
Executive Summary
Findings
The analysis identified five distinct clusters of areas, each with unique characteristics related to digital capability, availability of local amenities, and COVID-19 outcomes. Crucially, there is a strong inverse relationship between digital propensity and COVID-19 infection rates, where communities with higher digital inclusion and literacy experienced lower average infection rates, even when access to physical amenities (like supermarkets and sports centres) was limited.
In practical terms, this means that individuals and areas lacking remote-work capability or with lower digital confidence were disproportionately affected during the COVID-19 pandemic, as they had fewer alternatives to in-person activities.
One cluster stood out for having the highest COVID-19 rates by a wide margin; notably, this cluster did not have extreme values in digital or amenities, suggesting that other unmeasured factors (such as housing density, occupation types, or institutional settings) contributed to the heightened infection levels there.
However, it is important to note that underlying biases and confounding factors (such as job type, income levels, deprivation, and demographic differences) play a role and overlap with these findings. For instance, many communities with low digital scores are also economically deprived or have older populations – factors which themselves contributed to higher COVID vulnerability. Such influences provide additional explanatory power when interpreting the results, and they temper any one-dimensional conclusion.
| Cluster | Mean Digital Propensity Score | Mean Covid 19 Inf Rate | Mean Supermarkets | Mean Sports Facilities | Observations |
|---|---|---|---|---|---|
| 0 | 0.953 | 289.7 | 1.48 | 8.26 | 1322 |
| 1 | 0.940 | 301.9 | 5.86 | 17.65 | 721 |
| 2 | 0.943 | 312.4 | 1.92 | 30.96 | 1016 |
| 3 | 0.921 | 306.6 | 1.89 | 11.87 | 1745 |
| 4 | 0.944 | 353.6 | 1.48 | 10.09 | 1873 |
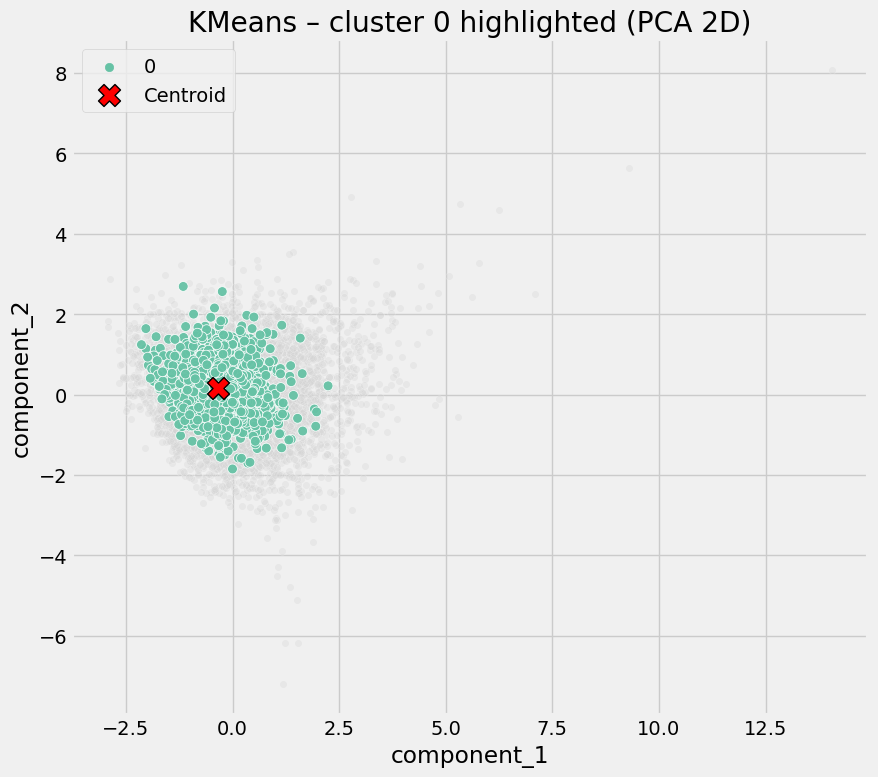
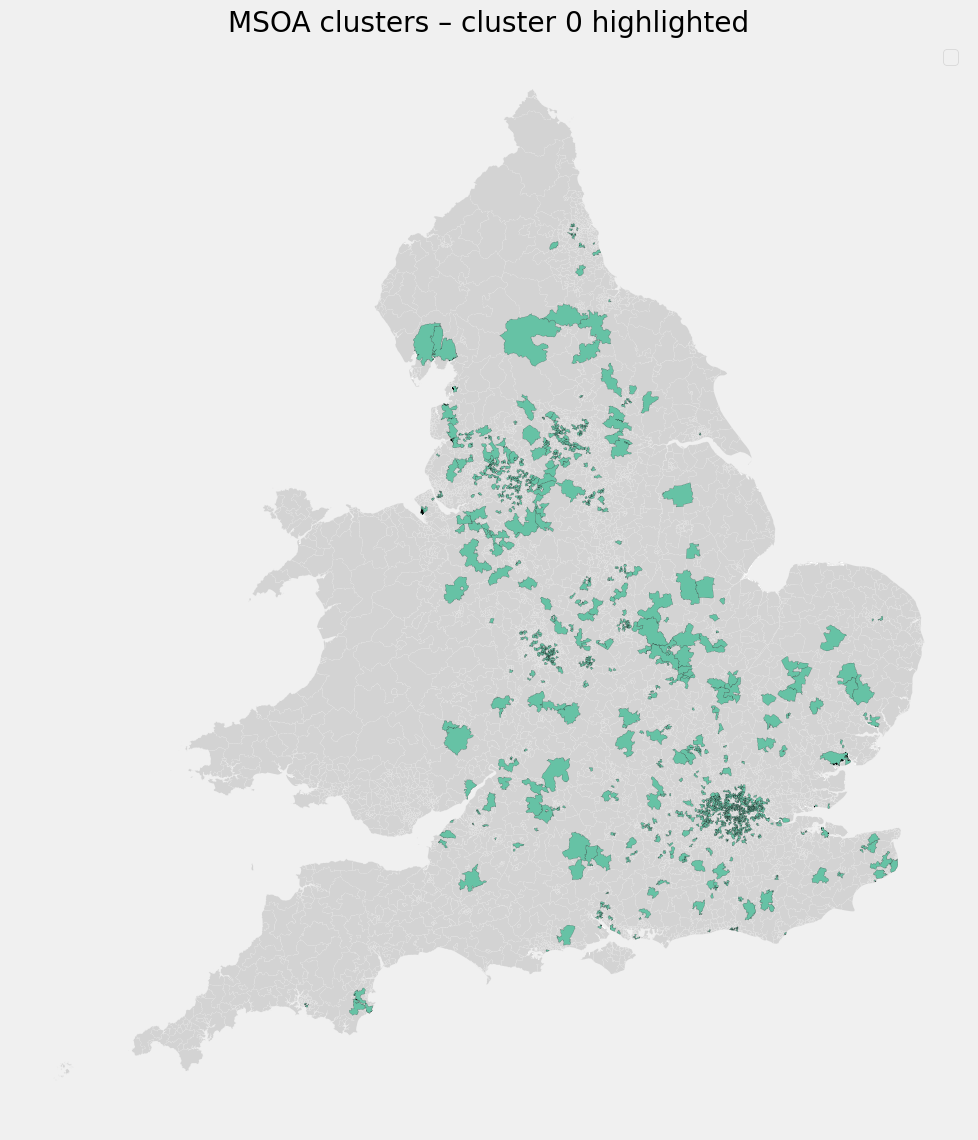
Cluster 0 - Digitally Enabled, Low-Amenity Areas
| Cluster | Mean Digital Propensity Score | Mean Covid 19 Inf Rate | Mean Supermarkets | Mean Sports Facilities | Observations |
|---|---|---|---|---|---|
| 0 | 0.953 | 289.7 | 1.48 | 8.26 | 1322 |
Defining characteristics:
- Moderate to high digital propensity
- Low access to physical amenities (few supermarkets, few sports facilities)
- Lower average COVID rates
Interpretation
These areas appear to benefit from digital inclusion: residents are more able to work remotely, access services online and reduce physical contact despite limited local infrastructure.
Cluster 1 - Commercial & Retail Activity Centers
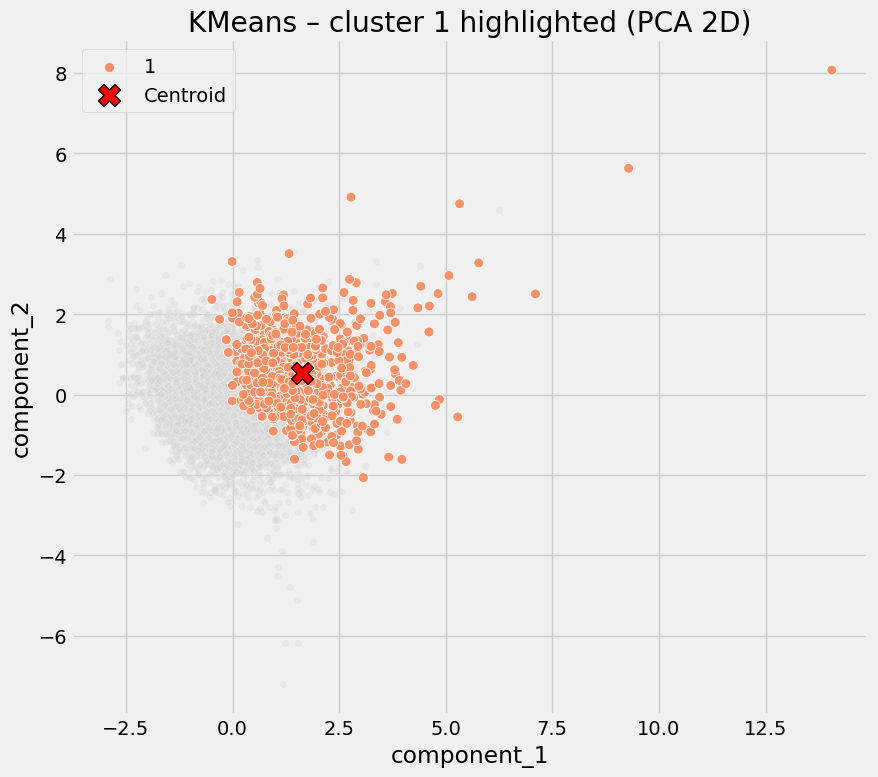
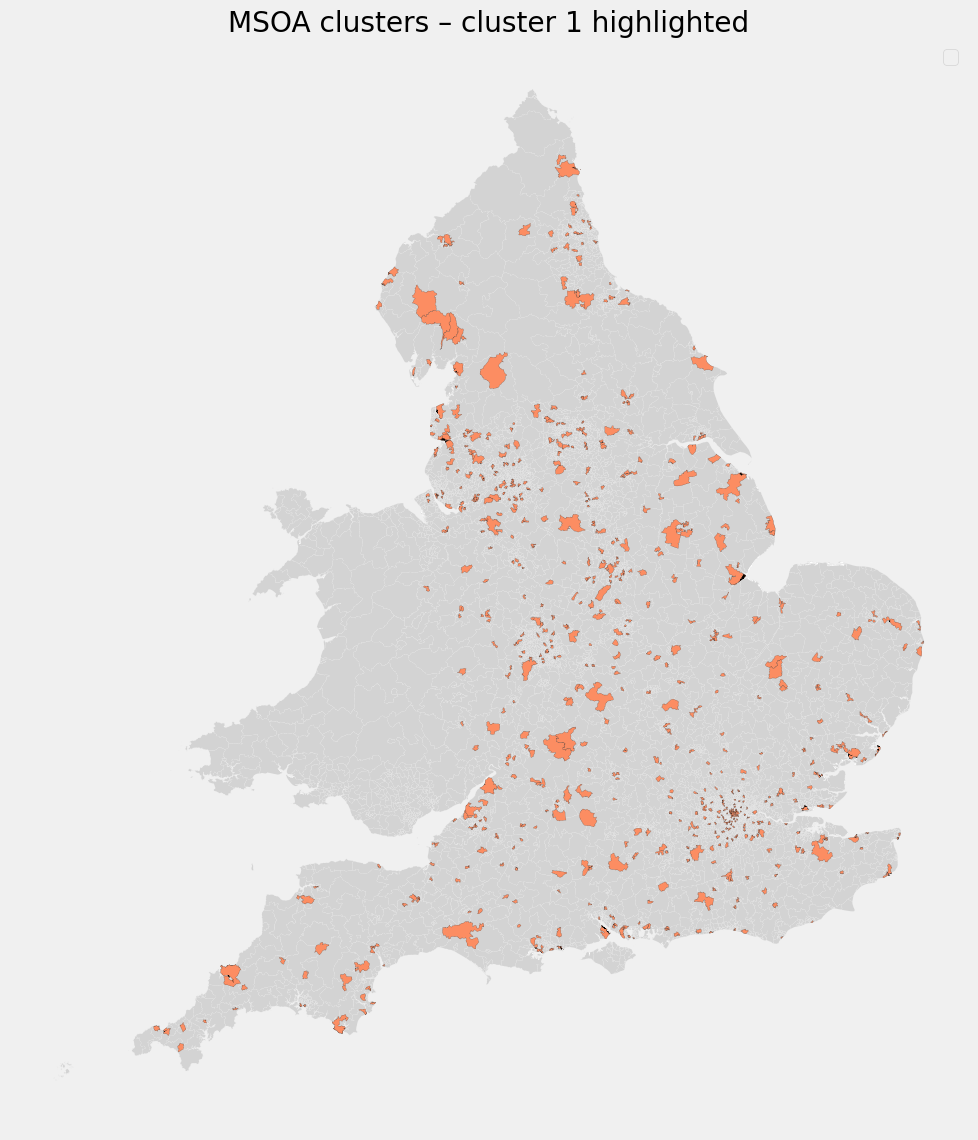
| Cluster | Mean Digital Propensity Score | Mean Covid 19 Inf Rate | Mean Supermarkets | Mean Sports Facilities | Observations |
|---|---|---|---|---|---|
| 1 | 0.940 | 301.9 | 5.86 | 17.65 | 721 |
Defining characteristics:
- Slightly lower digital propensity than Cluster 0
- Highest supermarket density
- High sports/leisure facility availability
- Moderately elevated COVID rates
Interpretation
These are high-footfall, service-rich areas. Even with reasonable digital capability, frequent in-person activity likely increased exposure risk.
Cluster 2 - High Social Interaction Zones
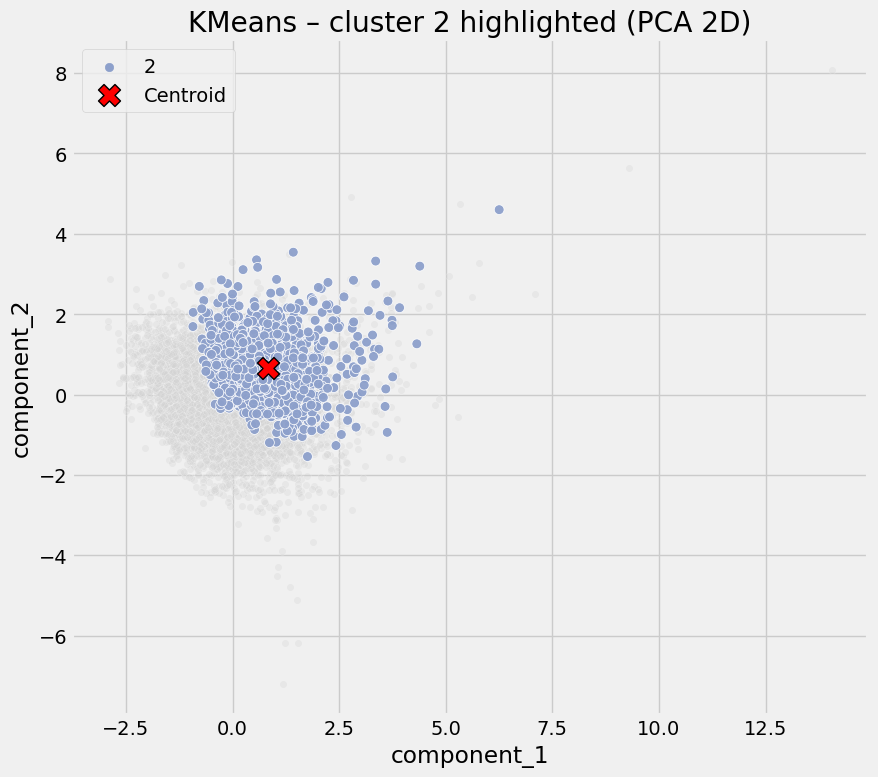
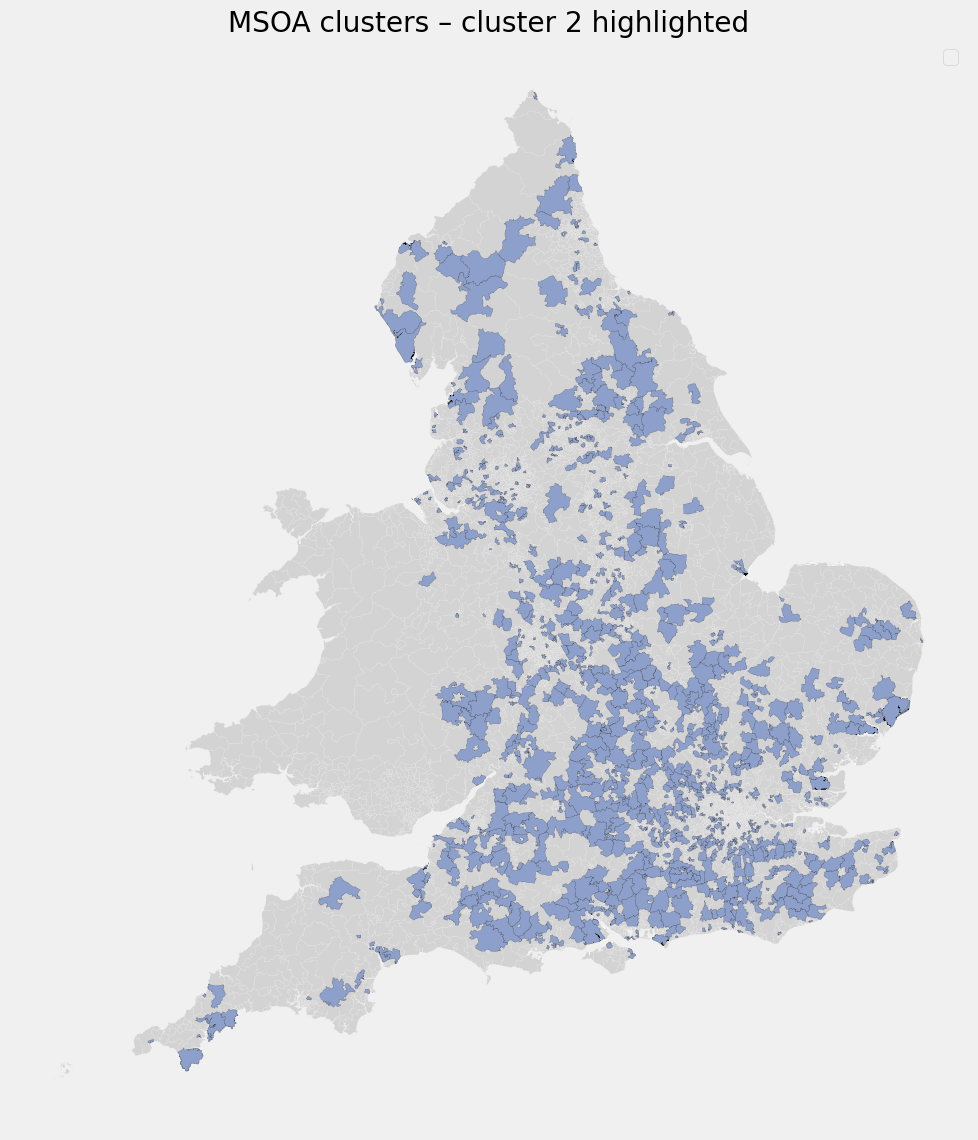
| Cluster | Mean Digital Propensity Score | Mean Covid 19 Inf Rate | Mean Supermarkets | Mean Sports Facilities | Observations |
|---|---|---|---|---|---|
| 2 | 0.943 | 312.4 | 1.92 | 30.96 | 1016 |
Defining characteristics:
- Moderate digital propensity
- Extremely high sports and leisure facility density
- Only moderate retail presence
- Elevated COVID rates
Interpretation
COVID risk here appears driven by social congregation, not deprivation or lack of digital access. Typical examples may include campuses, large leisure complexes, or multi-use community hubs.
Cluster 3 - Digitally Constrained Residential Areas
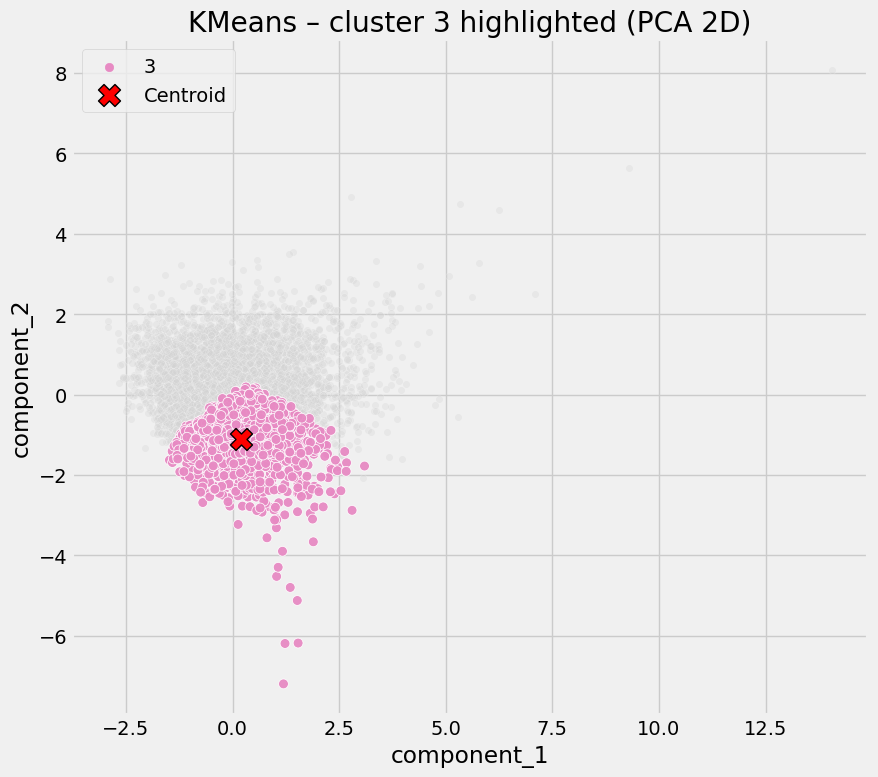
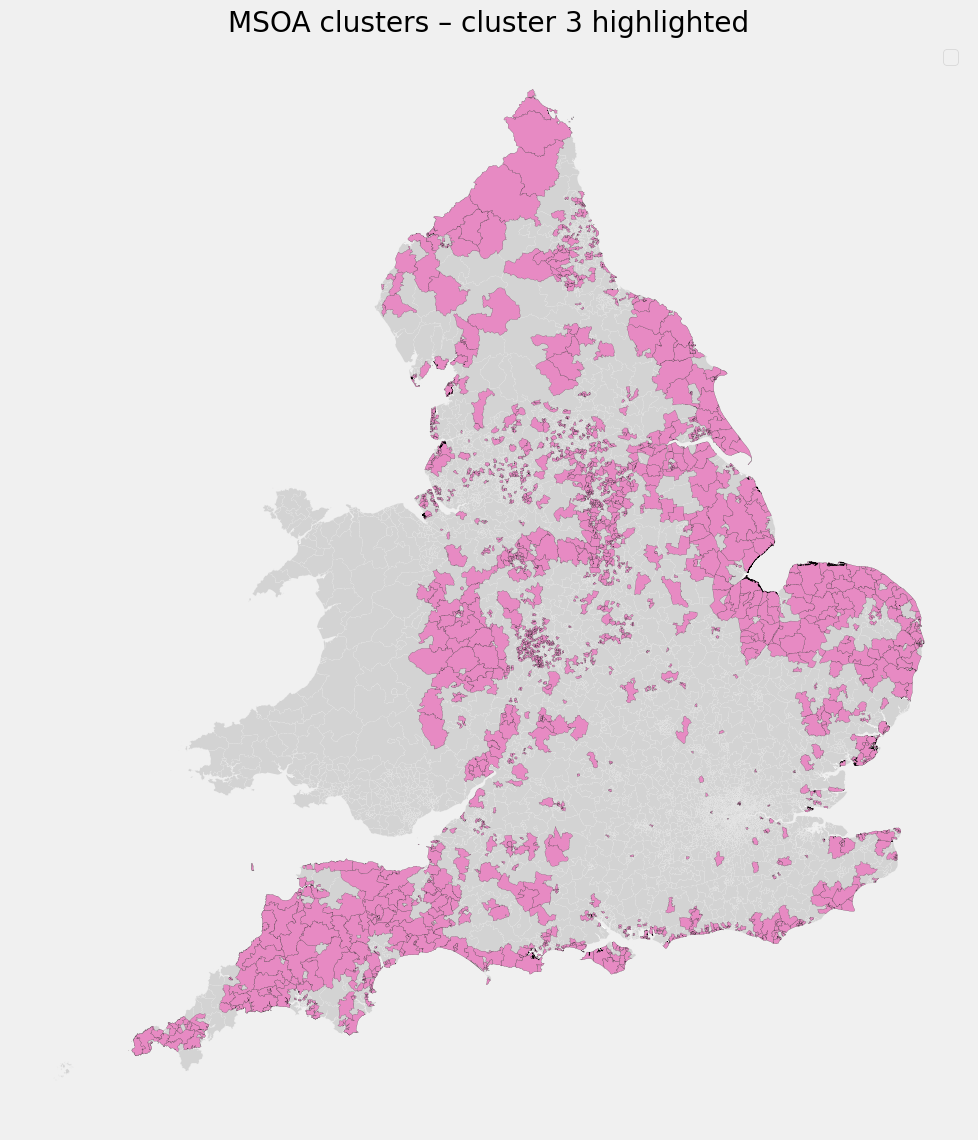
| Cluster | Mean Digital Propensity Score | Mean Covid 19 Inf Rate | Mean Supermarkets | Mean Sports Facilities | Observations |
|---|---|---|---|---|---|
| 3 | 0.921 | 306.6 | 1.89 | 11.87 | 1745 |
Defining characteristics:
- Lowest digital propensity
- Low amenity access
- Average COVID rates
Interpretation
These areas lack both digital alternatives and local infrastructure, leaving residents more exposed when restrictions require behavioral change. Risk here is structural rather than behavioral.
Cluster 4 - High-Risk Exposure Hotspots
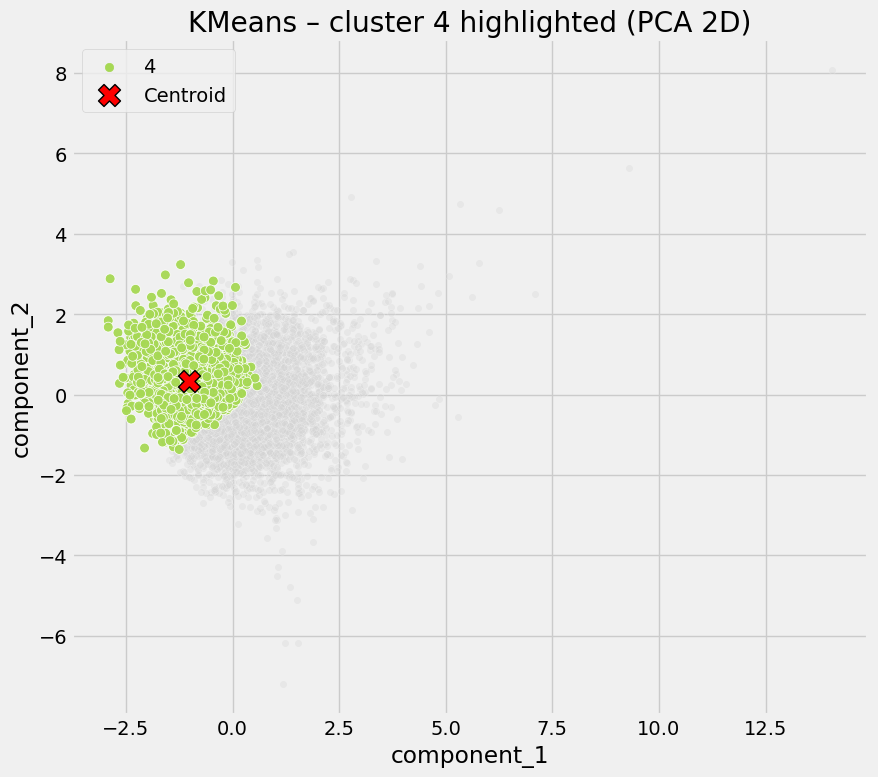
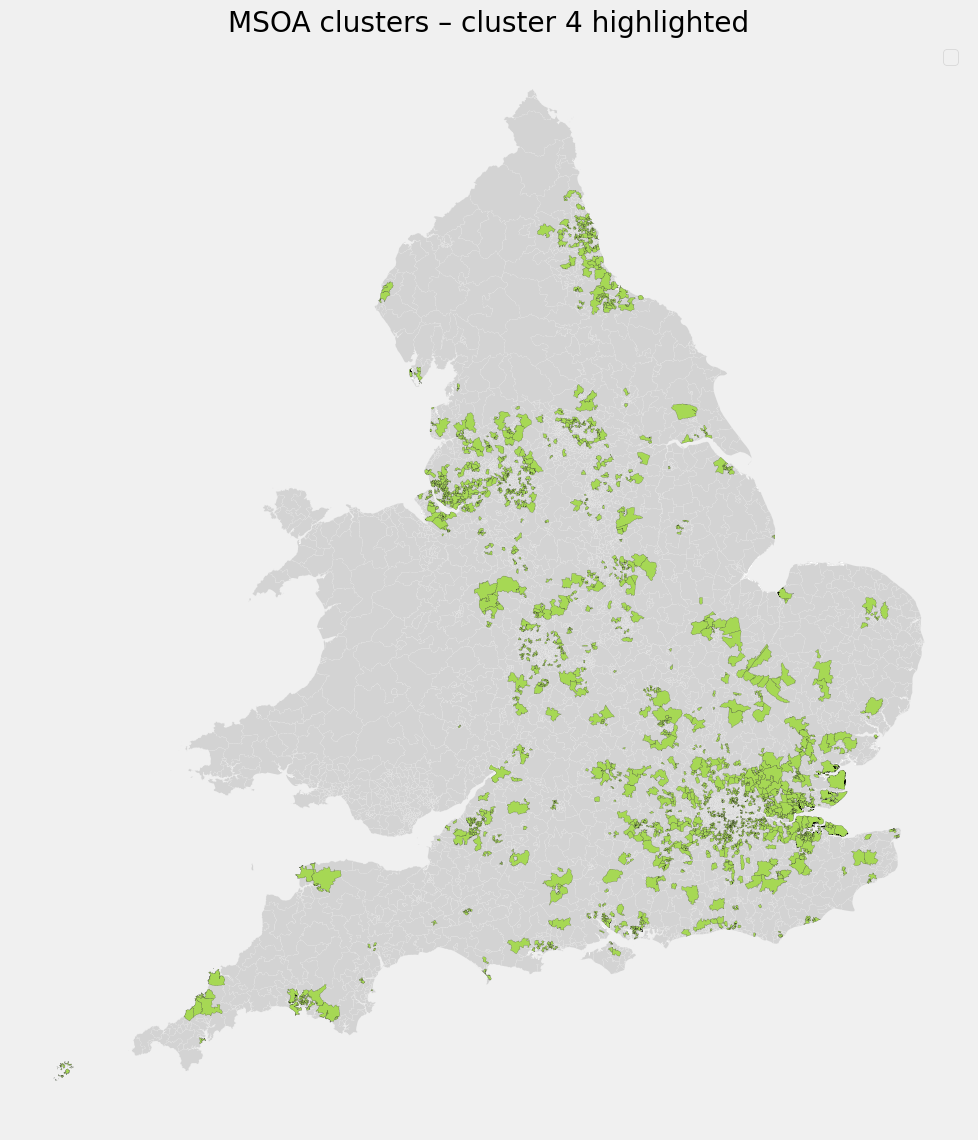
Defining characteristics:
- Digital propensity similar to other clusters
- No exceptional amenity access
- Highest COVID rates by a clear margin
Interpretation
This cluster is defined by outcomes rather than inputs. High infection rates likely reflect unobserved factors (e.g. care settings, workplaces, housing density) not captured in the current data set.
Purpose
The objective of this analysis is to understand how patterns of COVID infection relate to digital capability and access to physical amenities, by identifying distinct types of places rather than analysing individual variables in isolation.
Data & Method
Data used is area-level data containing:
- Digital propensity scores
- COVID-19 infection rates
- Counts of supermarkets
- Counts of sports and leisure facilities
To reduce dimensionality and minimise multicollinearity, the input features were first transformed using Principal Component Analysis (PCA). k-Means clustering was then applied to group areas into clusters with similar underlying characteristics.
This approach allows for identification of place-based typologies rather than single-factor explanations.
All data used is publically available.
Potential Application
This place typology can inform targeted policymaking and resource allocation in both pandemic response and digital inclusion initiatives. Public health authorities could use these insights to develop prioritisation zones in the event of a future pandemic.
For example, areas identified as “digitally constrained” (low digital access, low amenities) might be prioritised for support during lockdowns (mobile testing units, food delivery assistance, etc.), as residents have fewer means to cope with restrictions. On the other hand, areas labelled as “high social interaction zones” or “commercial centres” could be focal points for outbreak control measures.
Beyond immediate pandemic response, the findings highlight where to invest in digital literacy and infrastructure. If low digital propensity is linked to worse health outcomes, improving digital access in those communities becomes not just an economic or social goal but a health resilience strategy.
Fundamentally, this analysis provides a baseline for building patterns of risk and resilience based on place, not people. It is scalable, where additional data such as healthcare access, education level, etc. can be incorporated to refine the clusters. It offers a template for multidisciplinary interventions (combining digital policy with public health). In summary, the clustering results are directly usable for crafting nuanced, location-specific policies for both pandemic mitigation and digital inclusion strategies.
Bias & Other Research
It has been well researched that COVID infection and mortality rates affected people from an ethnic minority group, disabled and women (etc.) disproportionally.
Therefore, it is reasonable to assume that this will be reflected in the projects base data. This could be represented by:
- Income & Job type
- Neighbourhood deprivation
- Age, Gender, Ethnicity, Disability
Gov.uk - Health Inequalities, Deprivation, Poverty and Covid-19 Research
Gov.uk - Indices of Deprivation 2025
Encyclopedia
- LSOA = Lower Layer Super Output Area, which represents a group of postcodes in an area.
- MSOA = Middle Layer Super Output Area, which represents a group of LSOA area’s and a larger cohort of postcodes.
- DPS = Digital Propensity Score.
- PCA = Principal Component Analysis.
Approach
Data was collected from publically available sources and pre-processed before analysis into the required shape via Excel and Python. Full details on how this was acomplished are available in the python notebook.
The shape used in this analysis is MSOA level data.
Tools used:
- Python 3.11
- Excel
Python dependencies:
- ydata-profiling
- kneed
- seaborn
- geopandas
- pandas
- matplotlib
- sklearn
- numpy
- imageio.v2
- IPython.display
!pip install ydata-profiling
!pip install kneed
!pip install seaborn
!pip install geopandas
!pip install pandas
!pip install matplotlib
!pip install sklearn
!pip install numpy
!pip install imageio.v2
!pip install IPython.display
Due to file size limits, users will need to download the full MSOA geojson file from data.gov.uk Site, rename it to ‘msoa_geo_data.geojson’ and place it in the /Files directory. (Direct link download here).
A full python notebook including all steps taken is available here.